Growing up is complicated. A child's first five years involve more biological change, developmental leaps, and medical touchpoints than any other period in their life. Weight doubles, then triples. Height increases by 50% before the first birthday. The brain forms a million neural connections per second. And through it all, the pediatrician is tracking growth curves, immunization schedules, developmental milestones, feeding patterns, and a dozen other data points that determine whether this child is thriving or needs intervention.
In most practices, that tracking happens on paper. Growth is plotted by hand on a photocopied WHO or CDC chart. Immunizations are recorded on a card the parent is supposed to keep — and frequently loses. Developmental milestones are assessed through conversation and documented in free-text notes that are nearly impossible to compare across visits. The pediatrician carries the full picture in their head, because the chart doesn't present it coherently.
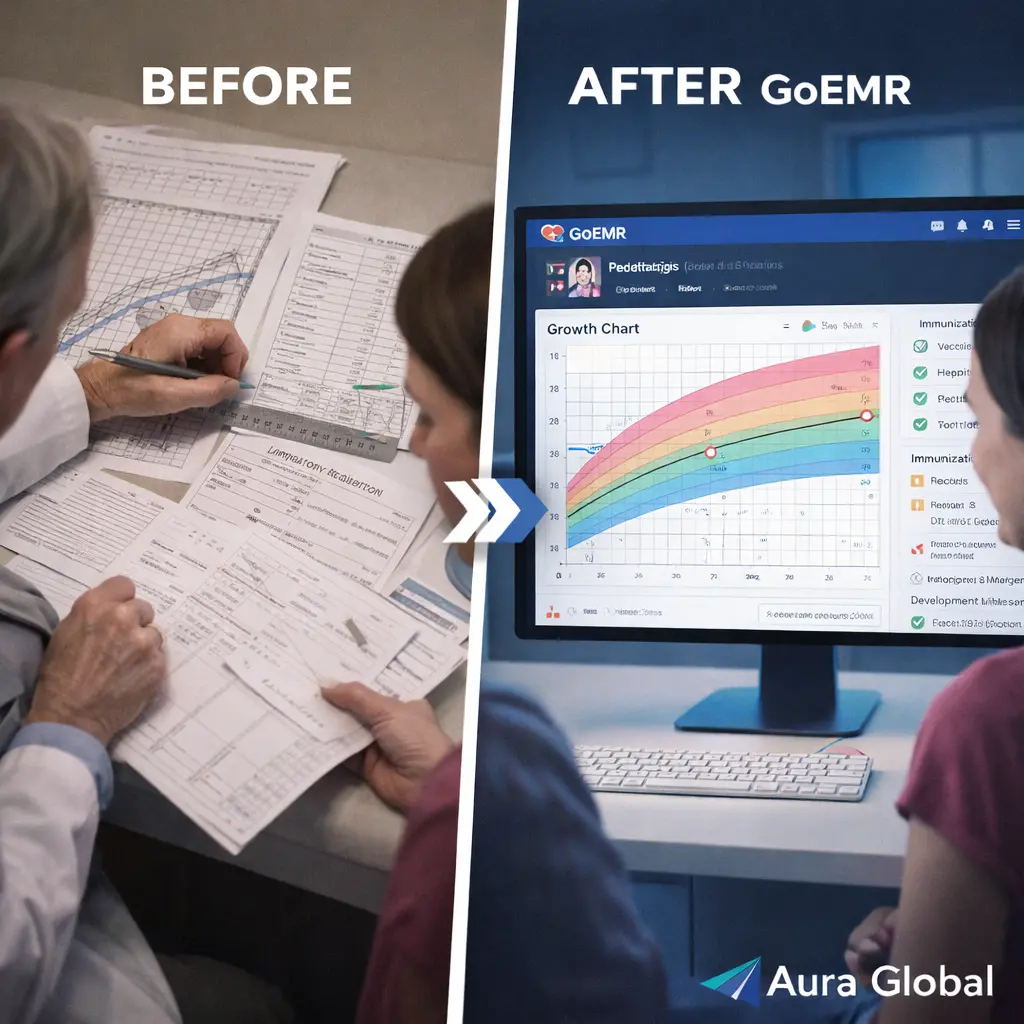
AuraEMR's Pediatrics module was built for the specialty that generates more longitudinal data per patient than any other. Growth plotted automatically on WHO and CDC percentile charts. Immunization schedules synced with ACIP guidelines, with alerts for doses due and overdue. Developmental screening tools scored in real time. And parent-friendly visit summaries that turn clinical data into information families can actually use. Because every child deserves a doctor who sees the full picture — and a system that makes it impossible to miss what matters.
The Paper Growth Chart Problem
The paper growth chart has been the backbone of pediatric practice for decades. A simple grid with percentile curves, a pencil, and a ruler. Plot the weight, plot the length, connect the dots, and see if the child is following a curve. It works. It's intuitive. And it's completely inadequate for modern pediatric care.
The problems with paper growth charts are so familiar that most pediatricians have stopped noticing them:
- Manual plotting errors — Plotting a point on a paper chart requires reading the measurement, finding the correct age on the x-axis, locating the value on the y-axis, and marking the intersection. It's easy to misplot by one or two gridlines — an error that can shift a child from the 25th percentile to the 50th or vice versa. In a busy well-child clinic seeing 30 patients a day, plotting errors are not rare. They're inevitable.
- Wrong chart, wrong data — WHO charts are recommended for children under 2. CDC charts are used for children 2 and older. Boys and girls have separate charts. Weight-for-age, length-for-age, weight-for-length, head circumference, and BMI each have their own chart. A practice juggling eight different paper charts per patient is a practice where the wrong chart gets used. A boy plotted on a girl's chart. A 20-month-old plotted on a CDC chart instead of WHO. These aren't hypothetical errors — they're documented sources of misdiagnosis.
- No calculated percentiles — A paper chart shows approximately where a point falls relative to the printed curves. Is that the 23rd percentile or the 28th? On paper, it's a guess. And the difference between the 3rd percentile and the 5th percentile — a distinction that can trigger a failure-to-thrive evaluation — is impossible to determine visually from a printed curve.
- Lost charts — Paper gets lost. Charts get misfiled. A child who transfers from one practice to another starts with a blank growth chart because the previous data didn't transfer. Years of growth history — the most valuable longitudinal dataset in pediatrics — vanishes because it was locked in a paper file at a practice the family no longer visits.
- No alerts — A paper chart doesn't tell you that a child dropped from the 50th percentile to the 15th percentile over two visits. It doesn't flag that the head circumference is crossing percentile lines. It doesn't alert you that the BMI has entered the obese range. The pediatrician has to notice these patterns themselves — while simultaneously managing the clinical encounter, answering parent questions, and documenting the visit.
A growth chart is only useful if it's accurate, complete, and interpreted correctly. Paper fails on all three counts more often than any pediatrician would like to admit.
Digital Growth Charts Done Right
AuraEMR doesn't just digitize the paper growth chart. It reimagines what growth tracking can be when the data is structured, the math is automated, and the clinical intelligence is built in.
- Automatic plotting from vitals — When the nurse records a child's weight, length or height, and head circumference during intake, AuraEMR automatically plots those measurements on the appropriate growth chart. No manual plotting. No ruler. No chance of misplotting. The data flows from the vitals entry directly to the chart in real time.
- Correct chart selection — AuraEMR automatically selects the appropriate chart based on the child's age, sex, and the measurement being plotted. Under 2 years: WHO charts. Over 2 years: CDC charts. Boys get boy charts. Girls get girl charts. BMI is calculated and plotted for children 2 and older. The system doesn't rely on someone grabbing the right paper chart from a drawer — it selects the right one every time.
- Exact percentile calculations — Instead of eyeballing where a point falls between two printed curves, AuraEMR calculates the exact percentile using the WHO and CDC LMS (Lambda-Mu-Sigma) statistical parameters. A weight at the 4.7th percentile is displayed as 4.7 — not "somewhere between the 3rd and 5th line." This precision matters for borderline cases where clinical decisions hinge on whether a child is above or below a threshold.
- Z-score display — For children at the extremes of growth — below the 1st percentile or above the 99th — percentiles lose their resolution. AuraEMR displays Z-scores alongside percentiles, giving clinicians a more precise measure of how far a child's growth deviates from the median. A child at the 0.5th percentile and a child at the 0.1th percentile are in very different clinical situations, and Z-scores make that difference clear.
- Growth velocity tracking — A single measurement tells you where a child is. Two measurements tell you where they're going. AuraEMR calculates growth velocity — the rate of weight gain or linear growth over time — and flags when velocity falls outside the expected range. A child who's at the 30th percentile but decelerating rapidly is a different clinical scenario than a child who's been tracking steadily at the 30th percentile for two years. AuraEMR surfaces the trajectory, not just the position.
- Cross-percentile alerts — If a child's weight drops across two or more major percentile lines between visits, AuraEMR generates an alert. If head circumference is growing faster than expected relative to length, it's flagged. These crossing patterns are the earliest indicators of failure to thrive, endocrine disorders, or neurological conditions — and they're easy to miss on a paper chart where the last three visits are three dots that may or may not look like a downward trend.
Growth monitoring isn't about plotting dots. It's about understanding the story those dots tell. AuraEMR plots the dots accurately, calculates the numbers precisely, and alerts the clinician when the story changes direction.
Immunization Tracking Synced with ACIP Guidelines
The childhood immunization schedule is one of the most complex clinical protocols in medicine. By age 18, a child should receive doses of over a dozen different vaccines, each with its own timing requirements, minimum intervals, catch-up schedules, and contraindication rules. The ACIP (Advisory Committee on Immunization Practices) updates the schedule annually, and sometimes mid-year. Keeping track of what's due, what's overdue, and what needs to be caught up — for every patient, at every visit — is a task that exceeds the capacity of human memory.
In most practices, immunization tracking looks like this: a nurse checks the immunization record (if one exists), compares it against a printed schedule, determines what's due, and administers the vaccines. If the child is behind, the nurse tries to figure out the catch-up schedule — a task that requires consulting a separate ACIP catch-up table with minimum interval rules that vary by vaccine and by the child's age at the time of each prior dose. It's error-prone, time-consuming, and frequently results in either missed vaccines or unnecessary extra doses.
AuraEMR automates the entire process:
- ACIP schedule engine — AuraEMR's immunization module contains the complete ACIP recommended schedule, including routine doses, catch-up doses, minimum intervals, and minimum ages. The schedule is updated whenever ACIP publishes changes. The system always knows the current recommendations — the pediatrician doesn't have to check whether last year's chart on the wall is still accurate.
- Automatic due date calculation — Based on the child's date of birth and immunization history, AuraEMR calculates which vaccines are due at each visit. A 4-month well-child visit automatically shows DTaP dose 2, IPV dose 2, Hib dose 2, PCV13 dose 2, and rotavirus dose 2 as due — without anyone looking it up. If the child missed the 2-month visit and is presenting at 4 months with no prior vaccines, the catch-up schedule is calculated automatically with the correct minimum intervals.
- Overdue alerts — If a child is overdue for a vaccine, AuraEMR flags it with a visual alert. The alert appears on the patient's chart, on the provider's schedule view, and on the practice-wide immunization compliance dashboard. A child who missed their 12-month vaccines and is now 15 months old shows up as overdue — not as a gap that nobody notices until the school requires proof of immunization.
- Contraindication checking — AuraEMR cross-references vaccine components against the patient's documented allergies and medical conditions. A child with a documented severe egg allergy gets an alert before an egg-based influenza vaccine is administered. A child who is immunocompromised gets a warning before a live vaccine is ordered. The safety check happens at the point of ordering, not after the vaccine is drawn up.
- State immunization registry integration — AuraEMR submits administered vaccines to the state immunization information system (IIS) electronically. When a child transfers from another practice, their immunization history can be pulled from the registry — eliminating the "we don't have their records" problem that leads to unnecessary revaccination or missed doses.
- Combination vaccine logic — When a child needs multiple vaccines, AuraEMR identifies opportunities to use combination vaccines that reduce the total number of injections. If DTaP, IPV, and Hep B are all due, the system can suggest Pediarix (the combination) instead of three separate shots. Fewer injections means less distress for the child and faster throughput for the practice.
The immunization schedule is too complex for memory and too important for guesswork. Automate the tracking. Automate the alerts. Let the clinician focus on the child.
Developmental Milestone Tracking
Growth charts track the body. Developmental milestones track the brain. And while growth data is relatively straightforward — measure, plot, compare — developmental assessment is far more nuanced. Is the child babbling at 6 months? Pointing at 12 months? Using two-word phrases at 24 months? Walking independently? Making eye contact? Responding to their name? Each milestone has an expected age range, and a child who's behind in one or more domains may need early intervention — intervention that's dramatically more effective the earlier it starts.
In most practices, developmental assessment happens through conversation. The pediatrician asks the parent a series of questions, gets answers that may or may not be accurate, makes a clinical judgment, and documents it in a free-text note. There's no structured tracking across visits. There's no way to see at a glance which milestones have been met and which haven't. And there's no alert when a pattern of delays emerges that should trigger a referral.
AuraEMR brings structure and continuity to developmental tracking:
- Age-appropriate milestone checklists — At each well-child visit, AuraEMR presents a checklist of developmental milestones appropriate for the child's age, organized by domain: gross motor, fine motor, language, cognitive, and social-emotional. The checklist is based on CDC milestone guidelines and is updated when recommendations change. The provider checks off which milestones the child has met, which are emerging, and which haven't been observed.
- Longitudinal milestone view — AuraEMR maintains a timeline showing when each milestone was first achieved, across all domains. A provider looking at a 2-year-old's chart can see at a glance that gross motor milestones have been met on time, but language milestones are consistently delayed by 3–4 months. That pattern — which would be invisible in a stack of free-text visit notes — is the trigger for a speech-language evaluation.
- Delay alerts — When a child hasn't met a milestone by the expected age and hasn't demonstrated it by the next well-child visit, AuraEMR flags the delay. If delays are present in multiple domains, the alert escalates. The system doesn't replace clinical judgment — but it ensures that missed milestones don't get lost between visits.
- Referral integration — When developmental concerns are identified, AuraEMR can generate referrals to early intervention programs, developmental pediatricians, speech-language pathologists, occupational therapists, or behavioral health specialists directly from the milestone tracking interface. The referral includes the relevant milestone data, so the receiving provider has context without requiring the parent to retell the history from scratch.
Early identification of developmental delays is one of the most impactful things a pediatrician can do. The difference between intervention at 18 months and intervention at 36 months can be the difference between a child who catches up and a child who falls further behind. Structured milestone tracking makes early identification systematic, not serendipitous.
Built-In Screening Tools
Pediatric guidelines recommend a battery of standardized screening tools at specific ages. Autism screening at 18 and 24 months. Depression screening in adolescence. Lead exposure risk assessment. Maternal postpartum depression screening at well-child visits. Social determinants of health screening. Each of these screens has its own validated questionnaire, its own scoring methodology, and its own clinical action thresholds. Managing them on paper is a logistical challenge that many practices struggle with — resulting in screens that get skipped, scores that don't get calculated, and follow-up that doesn't happen.
AuraEMR integrates the most commonly recommended pediatric screening tools directly into the well-child workflow:
- M-CHAT-R/F for autism screening — At the 18-month and 24-month well-child visits, AuraEMR automatically presents the Modified Checklist for Autism in Toddlers, Revised with Follow-Up. The parent completes it on the check-in kiosk or patient portal before the visit. The score is calculated automatically and displayed in the chart. A score above the threshold triggers a follow-up interview flow and a recommendation for referral — all within the same interface.
- PHQ-A for adolescent depression — Starting at age 12, AuraEMR presents the Patient Health Questionnaire for Adolescents at annual well visits. The teen completes it privately on a tablet. The score is calculated, categorized by severity, and presented to the provider with guideline-based recommendations: score of 10 or above suggests moderate depression and warrants further evaluation. No manual scoring. No paper forms to collect and interpret.
- Edinburgh Postnatal Depression Scale — AAP guidelines recommend screening mothers for postpartum depression at the infant's 1-month, 2-month, 4-month, and 6-month well-child visits. AuraEMR presents the EPDS to the accompanying parent, scores it automatically, and alerts the pediatrician if the score suggests depression. The pediatrician can then provide resources and facilitate a referral to the mother's own provider — a handoff that saves lives but frequently falls through the cracks in paper-based workflows.
- Social determinants of health — Food insecurity, housing instability, parental stress, and exposure to violence all affect child health outcomes. AuraEMR includes validated SDOH screening questionnaires that can be administered at well-child visits. Positive screens are documented in the chart and linked to local community resources that the practice can provide to the family. Screening for social needs alongside clinical needs is how modern pediatrics addresses the whole child.
- Screening compliance dashboard — The practice can track screening completion rates across the entire patient population. What percentage of 18-month-olds received an M-CHAT this quarter? How many adolescents were screened for depression? Which screenings are falling through the cracks? This data supports quality improvement, PCMH recognition, and payer incentive programs that increasingly require documented screening compliance.
A screening tool that doesn't get used might as well not exist. Build it into the workflow, score it automatically, and act on the results — that's how screening saves lives.
Parent-Friendly Visit Summaries
A well-child visit generates a mountain of information. Growth measurements and percentiles. Immunizations administered. Developmental milestones discussed. Screening results reviewed. Anticipatory guidance on nutrition, sleep, safety, and behavior. Referrals made. Follow-up scheduled. The parent absorbs as much as they can during the 15-minute visit, but by the time they get to the car, half of it is forgotten. The other half gets confused with what their friend's pediatrician said.
Paper after-visit summaries in most practices are either nonexistent or unhelpful — a printout of the clinical note that reads like a medical record, not like information a parent can use. "WNL" and "HEENT normocephalic atraumatic" don't help a parent understand how their child is doing.
AuraEMR generates parent-friendly visit summaries that translate clinical data into plain language:
- Growth in context — Instead of "Weight: 10.2 kg, 45th percentile," the summary reads: "Your child weighs 22.5 pounds, which is in the healthy range. They're growing steadily along the same curve as their previous visits." Parents understand what "healthy range" means. They understand "growing steadily." They don't need to know what the 45th percentile means — they need to know their child is on track.
- Immunization record — The summary lists the vaccines administered at this visit, any side effects to watch for (with specific guidance like "A mild fever is normal and can be treated with infant acetaminophen"), and what vaccines are coming up at the next visit. Parents leave knowing what was given and what to expect.
- Developmental highlights — The summary includes which milestones the child has met and which ones to watch for and encourage before the next visit. "Your child is saying several single words. By their 18-month visit, we'd expect to see them pointing at things they want and following simple instructions like 'give me the cup.'" This transforms clinical milestone tracking into actionable parenting guidance.
- Anticipatory guidance — Age-appropriate anticipatory guidance is included based on AAP Bright Futures recommendations: what to feed the child, how much sleep they need, car seat safety reminders, screen time limits, and common safety hazards for their developmental stage. The guidance is pre-written by age band and customizable by the provider. It's the information the pediatrician would share verbally if there were more than 15 minutes in the visit.
- Portal delivery — The visit summary is available through the AuraEMR patient portal immediately after the visit. Parents can review it at home, share it with other caregivers (grandparents, daycare providers), and refer back to it when they can't remember what the doctor said about starting solid foods. It's also available in print for families who prefer paper.
Pediatric care doesn't end when the child leaves the exam room. It continues at home, every day, through the actions parents take based on the information they received. When that information is clear, specific, and accessible, parents make better decisions. And better parental decisions mean healthier children.
Because every child deserves a doctor who sees the full picture. And every parent deserves to see it too.
Every milestone. Every vaccine. Every percentile. One system.
AuraEMR's Pediatrics module plots growth automatically on WHO and CDC charts, syncs immunizations with ACIP guidelines, tracks developmental milestones, and generates parent-friendly summaries — because the full picture of a child's health shouldn't require a paper chase.