The heart doesn't wait. A cardiac event unfolds in minutes. An arrhythmia that was intermittent yesterday could become sustained today. An ejection fraction that was borderline six months ago could be critically low now. Cardiology is a specialty built on time-sensitive data — and yet, in most practices, that data is scattered across a dozen different systems, printouts, and fax machines.
A cardiologist seeing a patient for a follow-up shouldn't have to pull up one system for the ECG, another for the echo report, a third for the cath lab results, and a paper file for the blood pressure log the patient brought from home. The clinical picture is only as good as the data you can actually see at the point of care. If the data is fragmented, the picture is incomplete. And in cardiology, an incomplete picture can be a fatal one.
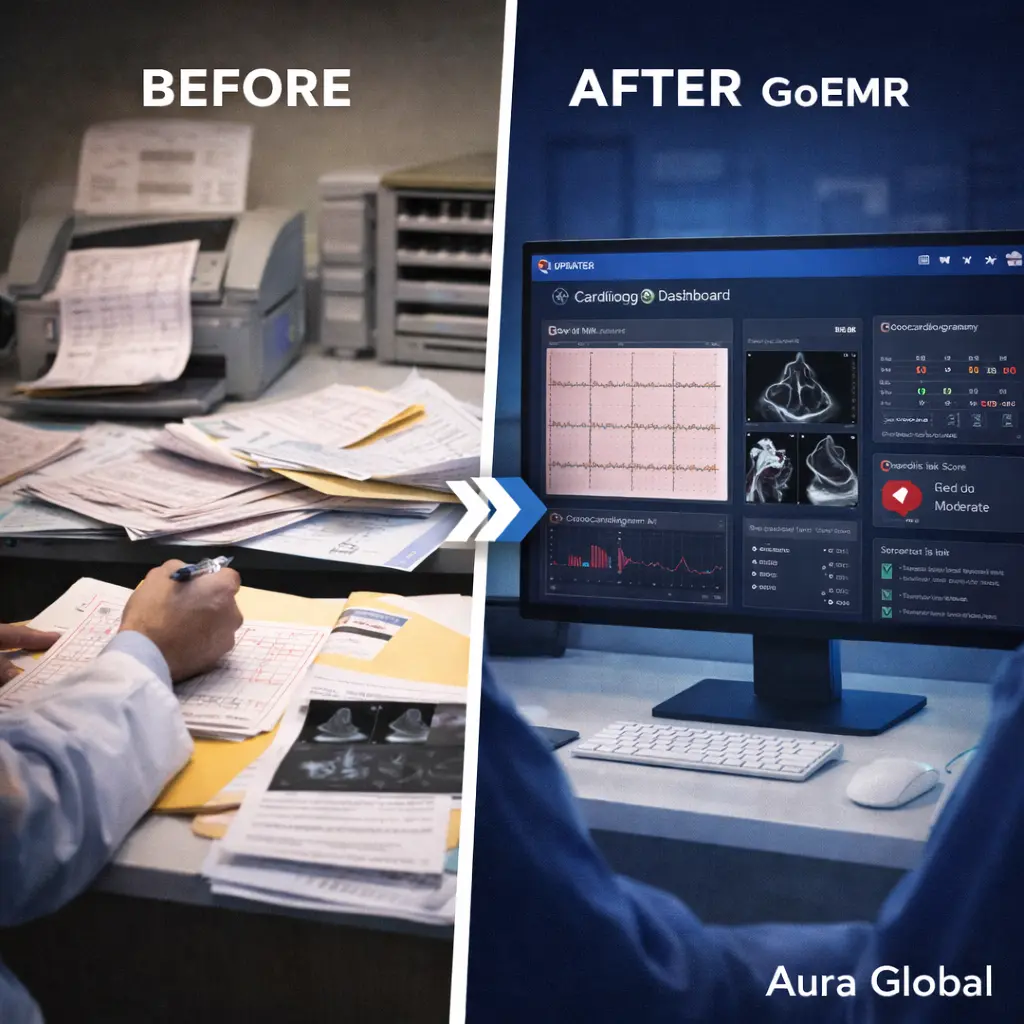
AuraEMR's Cardiology Dashboard was built on a single principle: every piece of cardiac data a cardiologist needs should be in one place, updated in real time, and presented in a format that supports clinical decisions — not a format that requires fifteen minutes of hunting before the patient encounter can even begin.
The Fragmented Cardiac Data Problem
Cardiology generates more data per patient than almost any other specialty. ECGs, Holter monitor readings, echocardiograms, stress test results, cardiac catheterization reports, blood pressure logs, lipid panels, coagulation studies, device interrogations for pacemakers and ICDs — the volume is enormous. And in most healthcare settings, that data lives in silos.
The typical workflow for a cardiologist reviewing a patient before an appointment looks something like this:
- ECG results — Stored in the ECG machine's proprietary system or printed on thermal paper that's been folded into the chart. Comparing today's tracing to one from three months ago means finding the old printout, assuming it wasn't misfiled or thrown away.
- Echocardiogram reports — Generated by the echo lab's reporting system, often as a PDF that gets faxed to the ordering physician. The cardiologist reads the report, but the raw measurements — ejection fraction, valve gradients, chamber dimensions — aren't in a format that allows easy comparison over time.
- Cath lab results — Documented in the cath lab's own system, sometimes dictated, sometimes handwritten on procedure logs. Getting a summary of findings into the patient's primary chart often requires manual transcription or a phone call.
- Blood pressure trends — Patients bring in handwritten logs, or the data comes from a home monitoring device that doesn't connect to anything. The cardiologist glances at the numbers, makes a mental note, and moves on — because there's no easy way to plot them against medication changes or other clinical events.
- Lab results — BNP levels, troponins, lipid panels, INR values for patients on anticoagulation — all sitting in the lab system, requiring a separate login or a search through a stack of printed results.
A cardiologist shouldn't spend the first ten minutes of every patient encounter assembling the chart. The chart should assemble itself.
Interactive ECG Tracing Viewer
The electrocardiogram is the most fundamental tool in cardiology. It's also one of the most poorly managed from a data perspective. In most practices, ECGs are either printed on thermal paper that fades over time or stored as image files in a system that doesn't allow comparison, measurement, or annotation. A cardiologist looking at an ECG from six months ago is often looking at a blurry photocopy, not a high-fidelity tracing.
AuraEMR's ECG viewer changes this entirely:
- Digital ECG storage with full fidelity — Every ECG recorded or imported into AuraEMR is stored as digital waveform data, not a static image. The tracing can be zoomed, scrolled, and measured at any time after recording. No more squinting at thermal paper. No more lost printouts.
- Side-by-side comparison — Select any two ECGs from the patient's history and view them side by side on the same screen. Overlay mode lets you superimpose tracings to visualize changes in morphology, interval duration, or axis shift. Subtle changes that would be invisible when comparing two separate printouts become immediately apparent.
- Automated interval measurements — AuraEMR automatically calculates and displays the PR interval, QRS duration, QT/QTc interval, heart rate, and axis. These measurements are stored with each ECG and trended over time. A QTc that's been creeping up across the last four tracings is flagged before it reaches a dangerous threshold.
- Annotation and interpretation — Cardiologists can annotate tracings directly — marking areas of ST elevation, flagging ectopic beats, or noting artifact. Previous interpretations are stored with the ECG and visible to any provider who views it later. The tracing and its clinical context travel together.
- Arrhythmia pattern detection — AuraEMR flags common arrhythmia patterns — atrial fibrillation, ventricular tachycardia, heart block — with visual highlights on the tracing. This isn't a replacement for clinical interpretation, but it's a second set of eyes that never gets tired, distracted, or rushed.
The ECG is too important to be treated as a disposable printout. In AuraEMR, every tracing is a permanent, searchable, comparable piece of the patient's cardiac history.
Echocardiogram Reports at a Glance
An echocardiogram generates a wealth of data — ejection fraction, chamber dimensions, wall motion assessments, valve gradients, diastolic function parameters, and more. In most systems, this data is locked inside a narrative report: a paragraph of text that buries the numbers in sentences. A cardiologist scanning the report has to read through prose to find the one number they need. Comparing this echo to the one from six months ago means reading two paragraphs side by side and mentally extracting the differences.
AuraEMR structures echocardiogram data so it's immediately useful:
- Structured data extraction — Key measurements are stored as discrete data points, not embedded in narrative text. Ejection fraction, LV dimensions, valve gradients, and diastolic parameters are each stored individually and available for trending, comparison, and alerting.
- Visual summary panel — The echo summary in AuraEMR presents the key findings in a structured panel: EF with a visual gauge, chamber sizes compared to normal ranges, valve function graded by severity (none, mild, moderate, severe), and an overall impression. A cardiologist can assess the echo results in seconds, not minutes.
- Longitudinal trending — Track ejection fraction over time on a line chart. See how valve gradients have progressed across multiple studies. Identify whether the patient's cardiac function is stable, improving, or declining — at a glance, not by re-reading old reports.
- Comparison view — Select any two echocardiograms and see the measurements side by side in a table, with changes highlighted. An EF that dropped from 45% to 35% is immediately visible in red, not buried in a sentence that reads "the ejection fraction has decreased compared to the prior study."
- Integration with clinical workflow — Echo results flow directly into the patient's cardiology dashboard alongside ECGs, labs, and vitals. The cardiologist doesn't need to open a separate system or request a faxed report. The data is there, structured and ready, before the patient walks through the door.
An echo report should answer questions in seconds, not require a treasure hunt through paragraphs. Structure the data. Surface the trends. Let the cardiologist focus on the patient.
Cardiac Risk Calculators Built In
Risk stratification is central to cardiology. Every clinical decision — whether to start a statin, whether to anticoagulate, whether to pursue invasive testing — depends on understanding the patient's risk profile. Cardiologists use validated risk calculators constantly: the ASCVD Pooled Cohort Equations, the CHA2DS2-VASc score for atrial fibrillation, the HEART score for chest pain evaluation, the TIMI risk score, the GRACE score, and others.
In most practices, calculating these scores means opening a browser, navigating to a calculator website, and manually entering values that already exist in the patient's chart. It's a small friction — a minute or two per calculation — but it adds up across dozens of patients per day, and it introduces the risk of transcription errors.
AuraEMR eliminates this friction entirely:
- Auto-populated risk scores — AuraEMR pulls the patient's age, blood pressure, cholesterol values, hemoglobin A1c, smoking status, and other relevant data directly from the chart and pre-fills the risk calculator. The cardiologist reviews the inputs, confirms or adjusts, and gets the score — without manual data entry.
- Multiple calculators in one place — ASCVD 10-year risk, CHA2DS2-VASc, HAS-BLED, HEART score, TIMI, GRACE, Framingham, and the ACC/AHA guideline-based statin benefit calculator are all built into the cardiology dashboard. No browser tabs. No bookmarked websites. No forgotten passwords to calculator apps.
- Longitudinal risk tracking — Risk scores calculated at each visit are stored and trended. A patient whose ASCVD risk score has climbed from 8% to 14% over two years has a different clinical story than one who's been stable at 8%. AuraEMR shows the trajectory, not just the snapshot.
- Guideline-linked recommendations — When a risk score crosses a clinical threshold — an ASCVD score above 7.5%, a CHA2DS2-VASc score of 2 or higher — AuraEMR displays the corresponding guideline recommendation. Not as a mandate, but as a clinical decision support nudge that keeps evidence-based care at the forefront.
- Shared decision-making tools — Risk scores are most powerful when patients understand them. AuraEMR generates patient-friendly risk summaries that can be shared during the encounter or printed as part of the after-visit summary. "Your 10-year risk of a heart attack or stroke is 12%" is a conversation starter that drives engagement.
Risk calculators are only useful if they're used consistently. When they're built into the workflow and pre-populated with chart data, they get used every time — not just when the cardiologist remembers to open a browser.
Longitudinal Blood Pressure Trends
Blood pressure management is the foundation of cardiovascular care. Hypertension is the single largest modifiable risk factor for heart disease, stroke, and kidney failure. And yet, in most practices, blood pressure data is one of the most poorly tracked metrics in the entire chart.
A typical scenario: the patient comes in, the nurse takes a blood pressure reading, it gets documented in today's visit note, and the encounter moves on. To see how blood pressure has changed over the last year, someone has to open each visit note individually and manually extract the numbers. Home blood pressure readings — which guidelines increasingly recognize as more reliable than office readings — are either ignored or scribbled on a piece of paper that gets filed somewhere and forgotten.
AuraEMR makes blood pressure a first-class data element in the cardiology dashboard:
- Automatic trending from visit data — Every blood pressure reading documented in AuraEMR — whether from an office visit, a telehealth encounter, or a nurse triage call — is automatically plotted on a longitudinal trend chart. Systolic and diastolic values are displayed over time with clear reference lines for normal, elevated, Stage 1, and Stage 2 hypertension thresholds.
- Home blood pressure integration — Patients can submit home readings through the AuraEMR patient portal or connected devices. These readings appear on the same trend chart as office readings, differentiated by source. The cardiologist sees the complete picture — not just the snapshot taken in the exam room when the patient was already nervous.
- Medication overlay — AuraEMR overlays medication changes on the blood pressure trend chart. When a new antihypertensive was started, when a dose was increased, when a medication was discontinued — all visible on the same timeline as the blood pressure data. Correlating medication changes with blood pressure responses doesn't require flipping between charts and medication lists. The answer is visual and immediate.
- Goal tracking — Set individualized blood pressure goals for each patient based on their risk profile and comorbidities. The trend chart shows not just where the patient's blood pressure has been, but whether it's meeting the target. A patient consistently running 145/92 against a goal of 130/80 is visually flagged for intervention.
- Exportable reports — Generate a blood pressure summary report for the patient, for a referring physician, or for the patient's insurance company when prior authorization for a medication requires documentation of treatment response. The data is always there, structured, and ready to share.
Blood pressure is the most measured vital sign in medicine. It should also be the most trended, the most analyzed, and the most acted upon. In AuraEMR, it is.
Seamless Cath Lab Coordination
The cardiac catheterization lab is where diagnosis meets intervention. A patient with chest pain gets a diagnostic catheterization; if significant disease is found, the intervention happens in the same session. The communication between the referring cardiologist, the interventionalist, the cath lab team, and the post-procedure care team has to be seamless. In most hospitals, it isn't.
Cath lab scheduling happens in one system. The pre-procedure checklist is on paper. The procedure report is dictated and transcribed days later. The post-procedure orders are written on a separate order sheet. And the referring cardiologist doesn't see the results until someone faxes or hand-delivers the report. Every handoff is a potential failure point.
AuraEMR integrates the cath lab workflow directly into the cardiology dashboard:
- Pre-procedure preparation — When a cardiac catheterization is scheduled, AuraEMR generates a pre-procedure checklist that includes consent documentation, allergy review (especially contrast allergy), current medications (with anticoagulation management guidance), relevant labs (creatinine for contrast nephropathy risk, INR if on warfarin), and prior imaging. Everything the cath lab needs is compiled automatically from the patient's chart.
- Real-time procedure documentation — During the procedure, findings can be documented in real time — vessel involvement, stenosis percentages, intervention performed, devices placed. This data flows into the patient's chart as the procedure progresses, not days later when the dictation is transcribed.
- Structured procedure reports — Cath lab results are stored as structured data: which vessels were studied, the degree of stenosis in each, whether intervention was performed, the type of stent placed and its location, final TIMI flow grades. This structured format enables comparison across procedures, tracking of stent patency over time, and quick reference during future encounters.
- Post-procedure order integration — Post-cath orders — dual antiplatelet therapy duration, activity restrictions, follow-up scheduling, and cardiac rehab referral — are templated and linked to the procedure. The transition from cath lab to floor or discharge is documented in the same system, with no gaps.
- Referring physician notification — The referring cardiologist receives an automatic notification when the procedure is complete, with a summary of findings and recommendations. No waiting for a fax. No calling the cath lab to ask "How did it go?" The information is there as soon as the case is closed.
The cath lab is too critical and too time-sensitive for communication gaps. When the procedure data, the clinical chart, and the care coordination all live in one system, nothing gets lost in translation. The patient gets better care. The team works more efficiently. And the cardiologist has the complete picture — before, during, and after the procedure.
Every heartbeat. Every data point. One dashboard.
AuraEMR's Cardiology Dashboard brings ECG tracings, echocardiogram reports, cardiac risk calculators, blood pressure trends, and cath lab coordination into a single, unified view — so cardiologists spend more time with patients, not hunting for results.